2.0 Initial Ideas & Brainstorming
Initial Ideas & Brainstorming
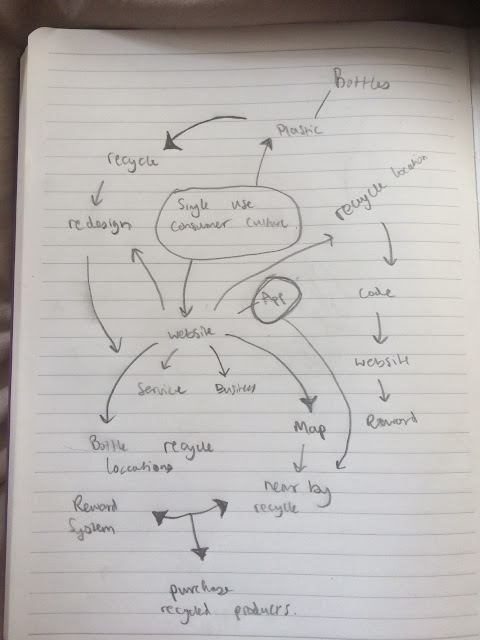
Sticking with the theme of Plastic and after reading through the brief of the competition, I will be focusing solely on trying to combat single use consumer culture, specifically targeted at the use of plastic bottles as they have one of the biggest impacts on plastic waste, I will discuss the life cycle of the plastic bottle in order to meet the brief, however, will also be raising awareness of the damage it does the the environment and wild life.
After doing some research I discovered that a whopping 91% of Plastic Isn't Recycled (News.nationalgeographic.com, 2018), so the main focus of my project will be on promoting recycling of plastics, specifically bottles and at the same time raise awareness.
Looking into the boroughs of London I have found that my very own borough, Enfield fell short in the recycling of non-household waste in 2015/16 at only 1.3% (Highlighted below). This is alarming to me, as someone who lives in the area I had no idea about these statistics, therefore I believe by creating something that can visualise these types of statistics and data will both look aesthetically pleasing but also raise awareness.
Looking into the boroughs of London I have found that my very own borough, Enfield fell short in the recycling of non-household waste in 2015/16 at only 1.3% (Highlighted below). This is alarming to me, as someone who lives in the area I had no idea about these statistics, therefore I believe by creating something that can visualise these types of statistics and data will both look aesthetically pleasing but also raise awareness.
| Authority | Percentage of household waste sent for reuse, recycling or composting 2015/16 | Percentage of household waste sent for reuse, recycling or composting 2014/15 | Percentage of non-household waste sent for reuse, recycling or composting 2015/16 |
|---|---|---|---|
| Newham LB | 14.7% | 17.2% | 17.1% |
| Westminster City Council | 17.3% | 19.1% | 13.9% |
| Lewisham LB | 18.0% | 17.1% | 11.0% |
| Barking and Dagenham LB | 18.9% | 23.4% | 40.7% |
| Wandsworth LB | 21.1% | 20.7% | 10.2% |
| Hammersmith and Fulham LB | 22.0% | 20.7% | 2.0% |
| Camden LB | 24.8% | 26.3% | 19.8% |
| Hackney LB | 24.8% | 25.3% | 14.6% |
| Royal Borough of Kensington and Chelsea | 25.9% | 25.3% | 11.1% |
| Tower Hamlets LB | 26.7% | 28.1% | 11.0% |
| Redbridge LB | 27.7% | 28.7% | 21.9% |
| Lambeth LB | 28.7% | 28.3% | 3.1% |
| Islington LB | 29.4% | 32.8% | 12.2% |
| City of London | 30.8% | 34.4% | 13.7% |
| Havering LB | 31.8% | 32.4% | 36.4% |
| Hounslow LB | 33.8% | 34.5% | 32.3% |
| Waltham Forest LB | 34.6% | 35.5% | 38.1% |
| Sutton LB | 34.7% | 37.6% | 36.3% |
| Greenwich LB | 34.8% | 34.3% | 48.6% |
| Merton LB | 34.8% | 37.5% | 34.6% |
| Southwark LB | 35.0% | 34.6% | 39.6% |
| Brent LB | 35.8% | 35.2% | 1.2% |
| Enfield LB | 35.9% | 38.5% | 1.3% |
| Haringey LB | 36.2% | 37.3% | 17.8% |
| Barnet LB | 36.8% | 38.0% | 23.9% |
| Croydon LB | 37.8% | 39.9% | 76.5% |
| Richmond upon Thames LB | 40.5% | 41.2% | 37.2% |
| Harrow LB | 40.9% | 45.1% | 1.2% |
| Ealing LB | 43.0% | 40.1% | 0.5% |
| Hillingdon LB | 44.1% | 43.8% | 10.2% |
| Royal Borough of Kingston upon Thames | 45.8% | 45.7% | 79.5% |
| Bromley LB | 46.3% | 48.0% | 1.9% |
| Bexley LB | 52.0% | 54.0% | 29.9% |
After brainstorming a few ideas of how I could combat the issue, I have an initial idea of a Paralax website which would work in the form of a online website which promotes the recycling of plastic bottles at certain recycling locations (Stores, Gyms, Schools...) but at the same time provides a scrolling experience which displays the life cycle of a plastic bottle from manufacturing, transportation, consumption and disposal. I will then provide at the bottom of the story/page the locations for recycling points or the option to add data to an open map of plastic pollution, thus helping create a larger open data map on plastic pollution. The main goal of my project is to raise awareness to the current issue regarding plastic pollution, and educate people on the long process it takes to create their plastic bottles, which are generally thrown away after one use. As of current it is now at a stage where we are producing more plastic than we are recycling, by visualising this open data in the form of a parallax scrolling website it will allow the end user can to digest it easier.


Comments
Post a Comment